What we learned from A/B testing two different optimizations against Facebook’s Store Traffic objective.
Your next customer is both digital savvy and very resourceful when it comes to finding the best product and/or service. In fact, more than 56% of those who visit a store and make a purchase are influenced by digital.
As an advertiser with an online presence and at a physical store location, it is important to bridge the gap between the online and offline shopping journeys. Walmart Grocery has the right idea when it comes to allowing customers to shop online or via a mobile app and then visit a local store.
And more platforms are making it easier for advertisers to adopt the Online to Offline experience. Facebook’s Store Traffic objective (previously known as Store Visits) helps those with brick and mortar stores direct online shoppers to their physical location.
We recently partnered with a leading US retailer who wanted to increase their in-store visits and purchases. Using the Facebook Store Traffic objective, we helped them find the most efficient way to increase both their in-store traffic and sales.
Store Traffic A/B Split Test: Optimizing towards Reach vs. Store Visits
Question: Which Facebook optimization drives an increase to in-store sales? Reach optimization or store visits optimization?
The Approach: To determine the most cost-effective approach, AdParlor setup a two-week A/B split test on Facebook using the Store Traffic objective. With a budget of $20k, we set up the test with half the budget towards a reach optimization and the other half towards store visits optimization.
- Reach Optimization serves ads to as many people as possible within a 15-mile radius of the brick and mortar store location.
- Store Visits Optimization serves ads to people who would be most likely to visit the store and purchase.
All variables (audiences, creative, and budget) were consistent with the only differentiator being ad delivery optimization.
Key metrics: Number of Store Visits, Return on Ad Spend, Cost per Store Visit.
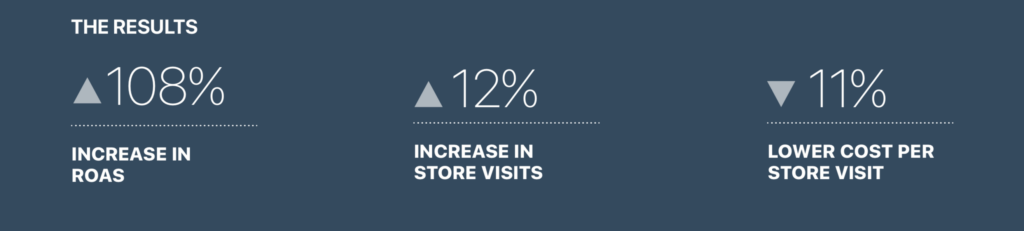
Results: The reach optimization results were positive. With an increase in the volume of the right people seeing the ads, store visits increased by 12%.
This resulted in a 108% increase in return on ad spend and subsequently lowered the overall cost per store visit by 11%. Based on the increase in store traffic and sales, we’re following our ongoing recommendation to optimize reach in ad delivery for Store Traffic campaigns.
If you have any questions on testing strategies or our results, contact our team . We’d love to talk!