
In previous articles, we have discussed the factors that affect user acquisition pricing overall and the interesting sub-topic around the rising cost of user acquisition over time. In this guest post, we will examine user acquisition in the “big four” English speaking countries – United States, United Kingdom, Canada, and Australia. Most Facebook games launch in English and many of them remain exclusively in English. So the goal of this analysis is to determine the ‘market attractiveness’ of these four countries by looking at three key indicators – available volume, advertiser competition, and user quality.
Available Volume
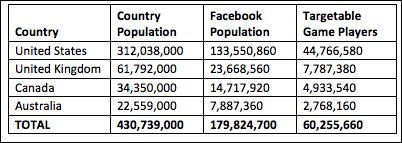
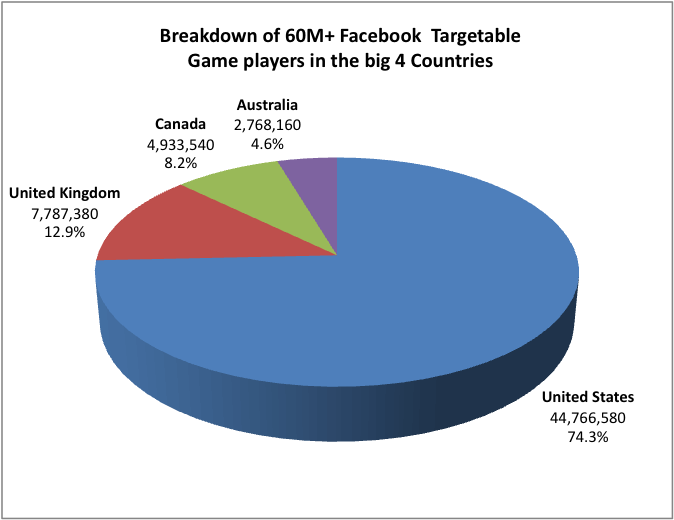
Looking at the table below, we can see that the United States makes up a large portion of the overall population and the Facebook population relative to the other three. This also translates when we compare the number of targetable game players in these countries. In fact, out of approximately 60 million targetable game players across these four countries, the United States encompasses 74% or almost 45 million of these users. (Note that targetable game players is different from total game players as Facebook ads allows you to target users who “like” the game – and not all of the games users.)
Many application developers, upon launching their game, focus strictly on the United States given the large user base available.
However, it is of course not just the user base that matters. Outside of the big four – there are many countries that have a significant Facebook population and consequently a large game player community. We also need to take a look at how competitive it is in advertising to these users versus how valuable they really are.
Advertiser Competition
For any particular country, the competitive landscape around Facebook ads is always changing. Tens of thousands of small advertisers constantly modify their ad spend – while the power players with large budgets strategically ramp up and slow down their marketing efforts at often unpredictable times. While the general consensus is that competition is increasing overall across Facebook Ads and that CPC bids are rising, we see that effective creative/copy along with efficient micro-targeting can still result in cost-per-install pricing being just as competitive as it was over a year ago.
Successful game developers will dig deep at the micro level and examine the competition specifically for targetable game players – and even deeper to determine the competition for players of their particular game genre. Trying to advertise a city-building game when other large advertisers are bidding on those same keywords will significantly increase the competition for those impressions, increasing CPC prices, and hence the cost of user acquisition.
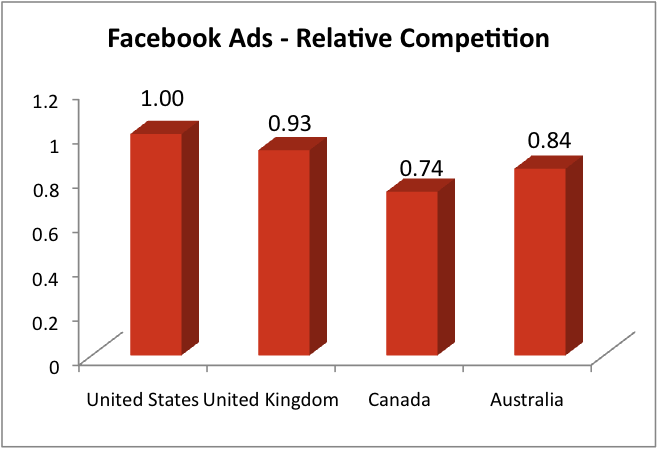
Given that the market for game specific advertising is always changing, it is difficult to predict how much competition you will run up against when starting your campaign. However, some analysis can be done at the macro-level. We see that competition within a country remains relatively consistent over short time periods – with the exception of holidays like Christmas. Hence, by following CPI prices at several points over the past few months from the millions of acquisitions delivered for Adparlor’s gaming clients, we have been able to come up with a relative competition scale for all four countries on Facebook. The graph to the right has been normalized to give the US a relative competition score of 1.00 so we focus on the difference between the United States and other English speaking countries. We can see from the graph above that the US is in fact the most competitive and Canada is the least competitive. The section below on user quality points to why this is the case.
User Quality
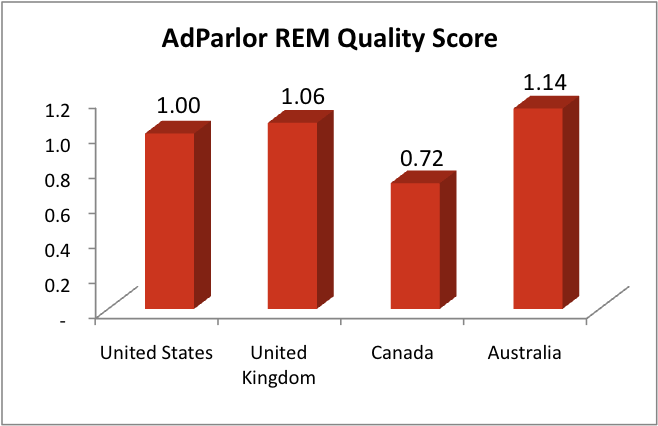
Now we come to the most important part of the analysis – user quality. Regardless of the volume available and the competition – the quality of the users is paramount in deciding which countries to advertise in. While this is normally difficult to measure, AdParlor has run hundreds of campaigns for game companies and we often measure deep metrics. We have combined the three most important metrics and devised a Retention, Engagement, Monetization (REM) score for these countries by giving a certain weight to each component – i.e. monetization has more weight than the other two metrics. It is important to note that these scores can vary widely per game based on many factors. The number and types of payment providers as well as the associated payment flow can have a significant impact on monetization and hence REM score.
We see some general trends — females perform better than males, older users perform better than younger users, and hard-core games perform better than casual games. However, there are also differences at a very granular level where we see certain genders and age ranges within certain countries monetize better for certain game genres. To protect the IP of our clients, we have decided to keep the specifics internal and simply publish these scores on an aggregate level for these four countries.
Conclusion
Now that we have looked at available volume, advertiser competition, and user quality, let’s relate that to market attractiveness. The data above shows that the REM score for Australia is higher than the United States while the competition for those users is lower. This is a clear indication that your marketing efforts should include the Australian users – however, does this mean you should shift your budget away from the United States?
The answer is no if you understand the relationship between volume, competition, and quality. You will notice that while those initial Australian users provide some very positive ROI, CPI rates will quickly increase given the limited population of game players available in this market. The fact remains that there are over 15 times more targetable gamers in the United States compared to Australia, meaning that CPI rates increase slower over time despite more competition for these users. For large campaigns, the United States will quickly catch up to Australia in terms of ROI as there are simply more users available at lower price points.
While the analysis of volume, competition, and quality on the
big four English speaking countries is interesting, the ‘fairness’ of the open market and an educated game developer community has balanced out the economy, making it difficult to gain a strong competitive advantage with this data. However, the breakdown across Europe, South-East Asia, and other areas prove to be more interesting where we see countries that have relatively high volume, low competition, and high REM scores. It is important to keep these three factors in mind, when assessing how valuable a country can be and deciding where to put your advertising dollars.