
Launched in 2008, Wednesday July 10th marked the 5th year of Apple’s acclaimed App Store. There are currently more than 900,000 apps available – with downloads topping the 50 Billion mark and showing zero signs of slowing down.
So who’s the favorite and just how many apps are downloaded in a year? Industry estimates range from 82 Billion global downloads to a more modest 56 Billion for this year, with predictions for that number to more than double to 200 billion app downloads by 2017. Not surprisingly, Facebook has taken the top spot as the most downloaded free app of all time but marketers still face the challenge of differentiation or “discoverability” and ensuring usage of the app.
Enter the rise of the Mobile App Install ad unit.
Less than a year old and it has already fueled Facebook’s entrance into the mobile space, attributing to nearly 30% of the company’s mobile revenue in Q1 of 2013. Additionally, research from ABI recently reported that they are expecting app revenues to top $25 Billion this year alone – with 65% percent attributed to smartphone apps and the remaining 35% stemming from tablet apps. They expect overall app revenue to triple by 2017. For advertisers and brands looking to gain awareness and drive application installs – this ad unit is a natural fit.
Taking a look at the international landscape for Mobile App Install units, AdParlor recently analyzed over a half Billion impressions sharing insights into some of the key trends and KPI’s across the globe.
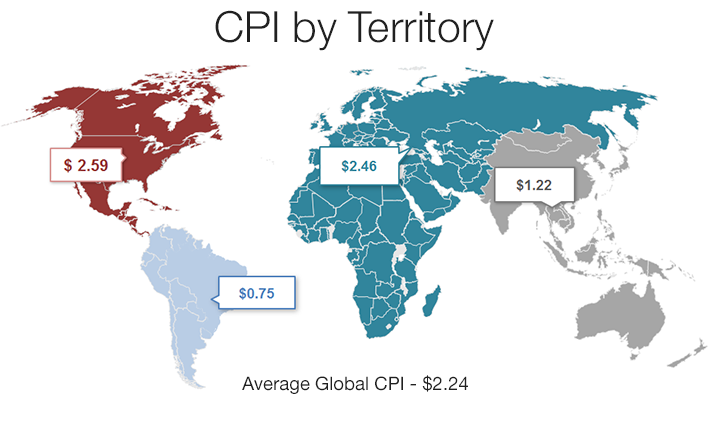
The North American and EMEA territories posted the highest cost per install or slightly more than 3x the average global CPI of $2.24. The maturity of these markets undoubtedly contributing to these figures as well as higher conversion rates with North America at an average of 13% and EMEA at 11.5%. In comparison, the APAC and LATAM regions have a slightly lower than average CPI at $1.22 and $0.75 – APAC showing an 11.18% CVR and LATAM at 7.68%. According to Flurry, a mobile application analytics firm, a number of Latin American countries are among the fastest-growing iOS and Android markets in terms of active devices. These emerging markets are expected to continue to grow at scale, contributing to monetization and revenue figures as smartphone adoption and usage continue to grow.
Russia has the most expensive mobile cost per install at $6.30, with Norway following at $5.06 and Finland closing out the top 3 most expensive CPI’s at $4.75. The United States and the United Kingdom rounded out the top 15 at $2.53 and $2.47 respectively. In comparison to Bulgaria, posting the lowest CPI at a $.54 cost per install. India’s average mobile app install CTR topped the list at 4.46% more than 5x Portugal’s CTR of .88%. Peru at 3.81% and Indonesia at 3.2%. The United States remained in the top 15 with a 1.49% CTR or slightly under the overall average of 1.57%.
Mobile app install CPC rates show a similar trend with Russia posting close to a 17x higher rate at $.82 in comparison to Peru at $.05. The U.S. rounded out the top 10 at a $.35 CPC – or 63% higher than the global average. The average CPM on mobile app install units is $3.00; however the average for Russia is almost 3x that at $8.86. Belgium and Luxemborg posted numbers closest to the average at $3.16 and $2.31; with the U.S. rounding out the top 5 highest CPM’s at $5.21.
There are significant variables that affect the performance of app install campaigns, with distribution still being the largest challenge. Marketers however; are becoming increasingly creative in utilizing strategies to gain awareness and testing new techniques to drive installs, such as:
- Using relevant and “real” images that resonate with your target audience will increase performance. We’ve seen increases of up to 36% in CTR after testing multiple creatives and using a clear call to action in the ad unit.
- Including an image of a device and/or an actual preview of the app is an additional testing parameter that can be used to increase the number of installs. Limiting the text associated with the ad unit and keeping it under the allotted 20% will aid performance, as well.
- Consistently refreshing and adding new creatives to keep the campaign up to date and relevant to a brand’s fan base is another technique our team utilizes – increasing awareness and ensuring the app remains top of mind to the intended audience.
As a relatively young ad unit, mobile app installs will undoubtedly become a key component in marketer’s future digital initiatives, especially as mobile advertising revenues continue to surge. According to a recent release by the IAB, global revenues jumped a staggering 82.8% to $8.9 billion in 2012 from $5.3 billion in 2011 and expect similar increases on Facebook as the company releases its Q2 numbers in the next few weeks.
As an inaugural member of the sPMD program, AdParlor has continued to demonstrate market leadership and innovation with the industry’s top brands and advertisers – contact us today to learn more about how are team can help you achieve your goals.